Array Formulas
Acumen metric formulas are based on "Single Value Result Array formulas." These work with a series of data, aggregate it (typically using the likes of SUM, AVERAGE or COUNT) and return a single value to the (ribbon, phase or intersection) analyzer.
Array formulas typically return a series of values. For example, in Excel, the formula =Row(A1:A5) returns only a single value (the first value in the list). An array formula will return all values for A1 to A5. Against the results of an array formula, you typically apply a container function such as SUM or AVERAGE or COUNT. These functions enable you to apply the function to the list of values and return a single value result.
Relating this back to Acumen, a ribbon, phase and intersection all contain one or more activities. In the case of phases and intersections, the activities may span across more than one phase or intersection and so certain data (duration, work and cost field types) gets pro-rated. When metric functions are applied during an Acumen analysis, they are applied to the ribbon, phase, or intersection indirectly being applied to all activities within that segment through the use of an array formula.
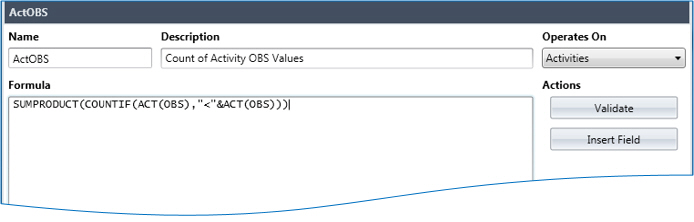
In the example below, the formula counts how many different OBS values the activities have that roll up to the control account or work package. You could use this calculated field at a control account level since a control account should only have one OBS. If it has more than one, then you know that there is an error
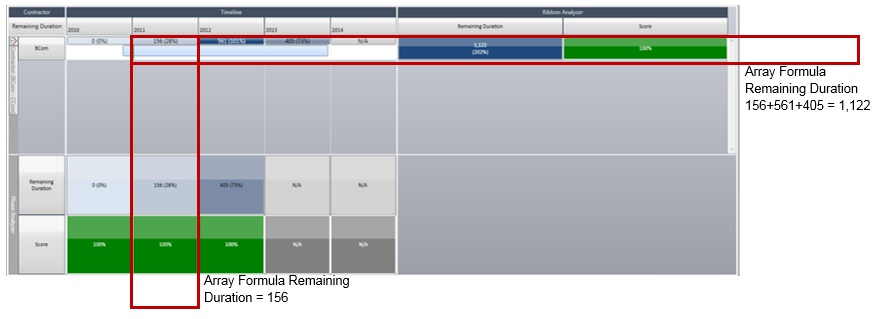
Here is an example of a ribbon and phase calculation of metrics: